Product: Abaqus/Explicit
Probability density of generator particles
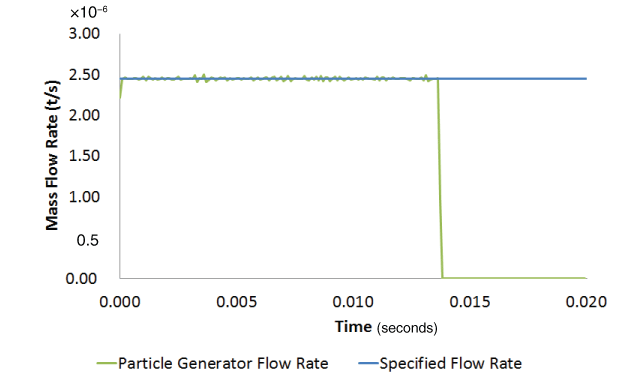
Mass flow rate per inlet area of generated particles
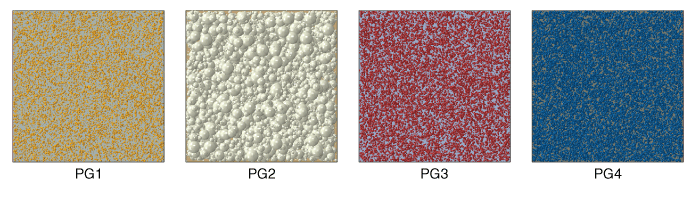
The probability density of generator particles and the mass flow rate per inlet area of generated particles are tested for four particle generators, each generating a single particle species. Each particle generator has a single faceted inlet surface with constant dimensions of 7 mm × 7 mm.
Table 3.25.2–1 lists the particle size probability density function (PDF) type and parameters for each particle generator species. The mass flow rate per unit inlet area for each particle generator species is held constant for the duration of the analysis. Particles of all species have a constant entry speed of 1000 mm/s. All generated particles in this problem continue to travel with the entry velocity along the normal direction to the generating inlet facet. Each particle generator can generate a maximum of 20000 particles. Figure 3.25.2–1 presents a view that is normal to the inlet facets showing the generated particles at the end of the analysis.
Table 3.25.2–1 Particle generator description.
| Particle generator | Probability density function | Particle size distribution | Mass flow rate per unit inlet area |
|---|---|---|---|
| PG1 | Normal distribution | Mean = 0.01 mm | 5.0 × 10⁸ t/mm2s for 0.02 s |
| Standard deviation = 0.02 mm | |||
| Minimum radius = 0.0005 mm | |||
| Maximum radius = 0.05 mm | |||
| PG2 | Log-normal distribution | Mean = 0.25 mm | 5.0 × 10⁸ t/mm2s for 0.02 s |
| Standard deviation = 1.0 mm | |||
| Minimum radius = 0.0005 mm | |||
| Maximum radius = 0.3 mm | |||
| PG3 | Uniform distribution | Minimum radius = 0.0005 mm | 5.0 × 10⁸ t/mm2s for 0.02 s |
| Maximum radius = 0.05 mm | |||
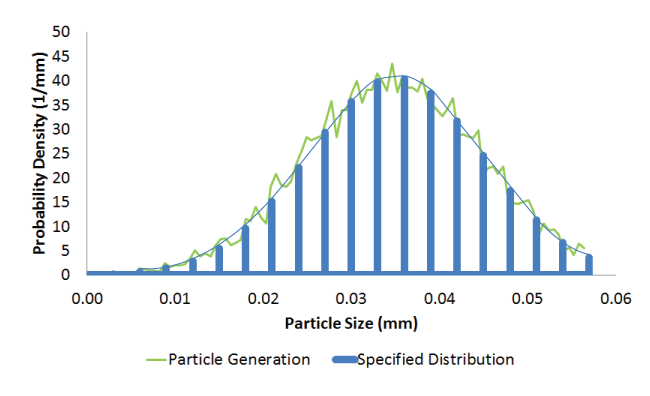
| PG4 | Piecewise linear distribution | Minimum radius = 0.0001 mm | 5.0 × 10⁸ t/mm2s for 0.02 s |
| Maximum radius = 0.057 mm |
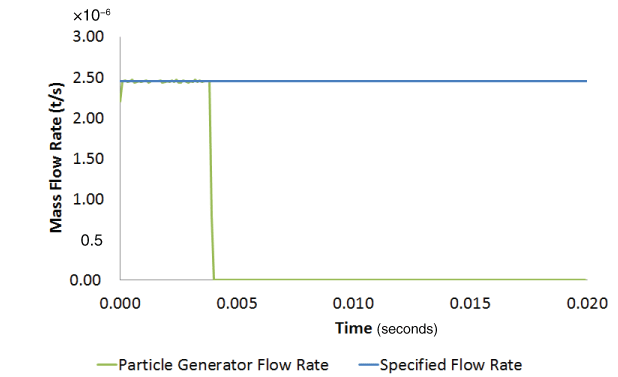
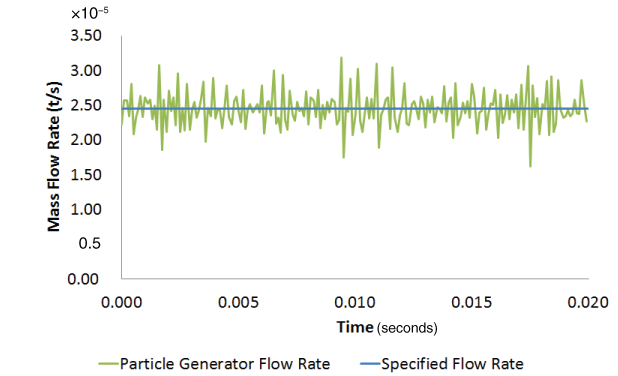
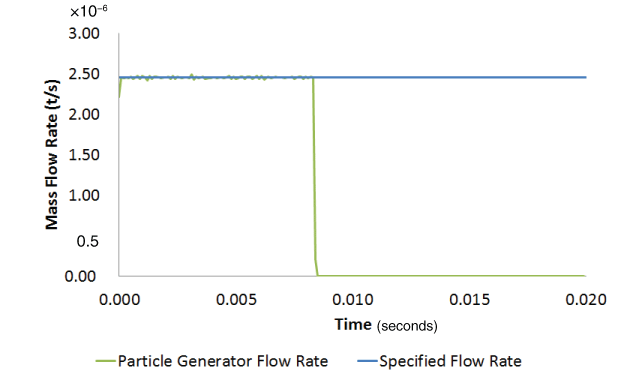
A direct user time increment of 1.0 × 10⁴ s was specified for the analysis. Generated and specified PDFs and mass flow rates are compared for particle generators PG1, PG2, PG3, and PG4.
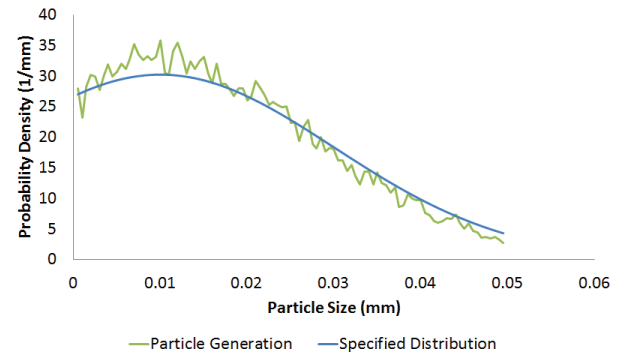
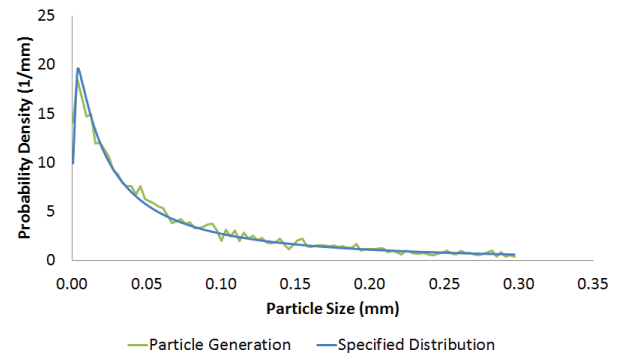
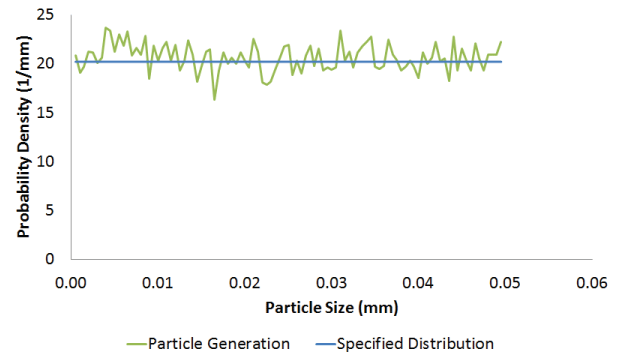
The specified normal and the log-normal probability density functions for particle generators PG1 and PG2, respectively, are truncated PDFs. Truncated analytical PDF curves are compared to the generated results for these two cases (see “Probability density function,” Section 2.12.1 of the Abaqus Analysis User's Guide, for more details on truncated PDFs). Figure 3.25.2–2 and Figure 3.25.2–3 show the comparison of generated PDFs with the specified truncated PDF for generators PG1 and PG2, respectively. Figure 3.25.2–4 and Figure 3.25.2–5 show the comparison of generated uniform and piecewise linear PDFs with the corresponding specified PDFs for generators PG3 and PG4, respectively.
The two main factors influencing the agreement between the generated and specified PDF are the rejection of candidate particle sizes during the generation process (see “Particle generator,” Section 15.3.1 of the Abaqus Analysis User's Guide, for further details) and the number of particles being generated. The figures show that the generated PDF follows the specified PDF in an average sense in all four cases.
Since the inlet area does not change, the mass flow rate (MFR) for this problem is
![]()