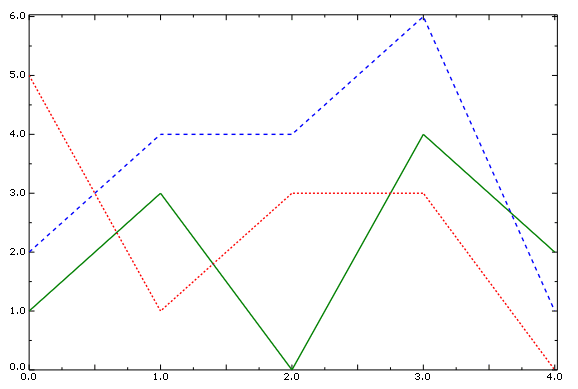
Use the Curve Options dialog box to customize the color, style, and thickness of the line used to represent an X–Y data object in an X–Y plot. Figure 47–42 illustrates some of the ways in which X–Y data curves can be customized.
The color, style, and thickness that you select appear along the curve and in the legend. The customization options are available only when Show is toggled on.
By default, Abaqus/CAE colors the X–Y curves in your plot by referring to the list of X–Y auto colors. You can modify this list from the Edit XY-Auto-Colors dialog box; see “Editing the list of auto-colors for X–Y plots,” Section 47.6.6.
To customize the appearance of a curve in an X–Y plot:
Locate the Show options.
The Show options appear in the lower right corner of the Curve Options dialog box.
From the Curves field, select one or more X–Y curves whose attributes you wish to customize.
Note: To make an X–Y curve available for selection, you must first plot it.
Toggle Show to display or suppress the line representing each selected X–Y curve.
When Show is on, the curve is displayed and the line attribute options are enabled.
Choose the line color:
Click the color sample ![]() .
.
Abaqus/CAE displays the Select Color dialog box.
Use one of the methods in the Select Color dialog box to select a new color. For more information, see “Customizing colors,” Section 3.2.9.
Click OK to close the Select Color dialog box.
The selected X–Y curve changes to the selected color.
Choose the line style:
Click the Style button to reveal the line style options (solid, dashed, etc.).
From the style list, click the desired line style.
The selected X–Y curve changes to the selected style.
Choose the line thickness:
Click the Thickness button to reveal the line thickness options.
From the thickness list, click the desired line thickness.
The selected X–Y curve changes to the specified thickness.
Click Dismiss to close the Axis Options dialog box.