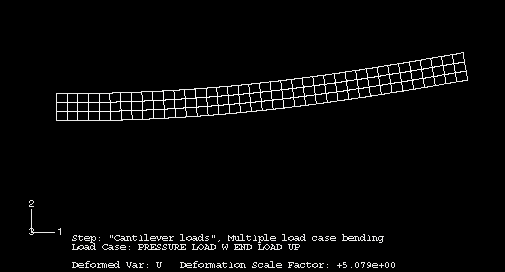
Load case output is stored in separate frames in the output database (.odb). You use the Visualization module to view and manipulate load case output. The load case name is displayed in the state block for each frame containing load case output. For example, Figure 34–5 shows the deformed plot for the Pressure Load w End Load Up load case of the cantilever beam model (see “Load case editors,” Section 34.3).
In the Visualization module you can linearly combine output from several load cases to represent an actual loading environment. You can also obtain the minimum or maximum value of a selected field variable over some or all load cases.
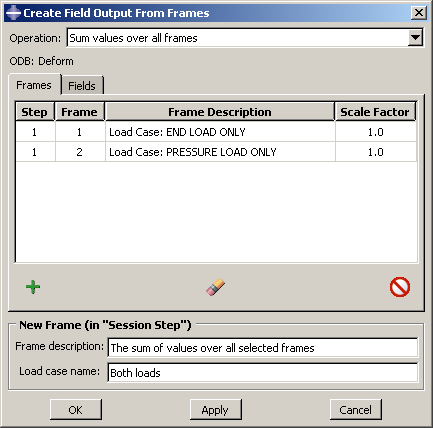
For example, you can combine the output from the End Load Only and Pressure Load Only load cases for the cantilever beam model to create new field output with a load case name of Both loads, as shown in Figure 34–6.
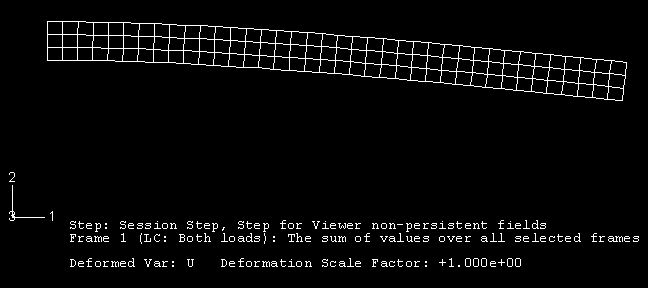
The new field output is contained in a frame of the session step and is available from the Field Output dialog box. Figure 34–7 shows a plot of the combined deformation results.For detailed information on manipulating load case output, see “Combining results from several frames,” Section 42.7.3.