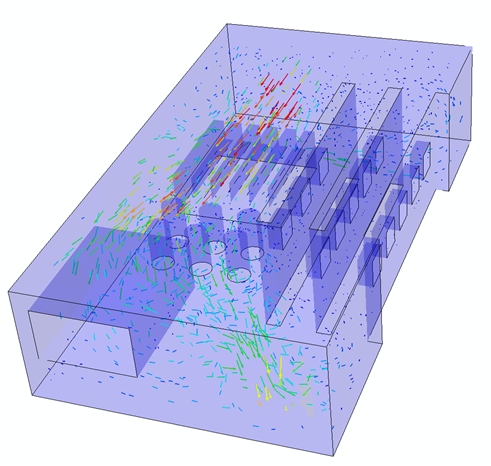
You can display the results of a fluid analysis in the Visualization module. Animations, line-type contour plots, isosurface-type contour plots, and results displayed along a path are particularly useful for viewing fluid analysis results. In addition, you can view the results from a co-simulation, such as a conjugate heat transfer analysis using Abaqus/CFD and Abaqus/Standard, as shown in Figure 30–1.