
Abaqus/CAE displays connectors modeled using connector section assignments in the Visualization module. You can control the display of connectors using display groups. Each connector is listed as an element set in the output database. For more information on display groups, see “Creating or editing a display group,” Section 78.2.1.
You can also use the Entity Display options in the ODB Display Options dialog box to control the display of symbols that represent connectors. You can control the following:
The highlighting of wire endpoints
The display of local orientation axes for connectors
The display of connector type labels
The size of the displayed symbols
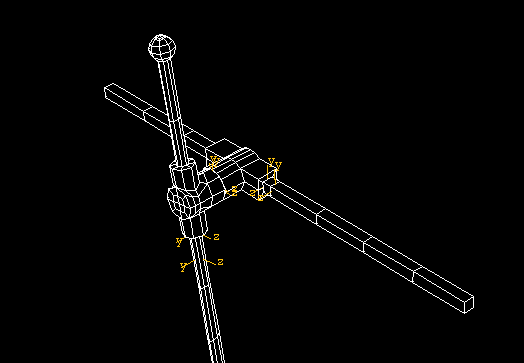
For example, you can use display groups to display four part instances and three connector element sets of the crank mechanism, as shown in Figure 24–4.
Figure 24–4 Selected part instance, connector, and connector symbol display in the Visualization module for the crank mechanism.
For information on plotting connector output results, see Chapter 44, “Contouring analysis results,” Chapter 45, “Plotting analysis results as symbols,” and Chapter 47, “X–Y plotting.”
The kinematics of connection types are formulated using an intrinsic coordinate system. The basis vectors of the intrinsic coordinate system are aligned with the directions associated with the components of relative motion. For some connection types (such as the CARTESIAN connection type), the intrinsic coordinate system aligns with the orientation directions at node a (see “Connection-type library,” Section 31.1.5 of the Abaqus Analysis User's Guide, for more information on connector orientation directions).
The components of connector vector output are resolved with respect to different coordinate systems depending on whether the output requested is field output or history output. For connector field output, the components of the vector are resolved with respect to the orientation directions at node a; for connector history output, the components of the vector are resolved with respect to the intrinsic coordinate system. Therefore, except for the connection types whose intrinsic coordinate systems align with the orientation directions at node a, plots of field output (symbol plots and contour plots) and history plots display different values for the requested connector vector components; the resultant is not affected by the choice of the coordinate system used to resolve the components.
